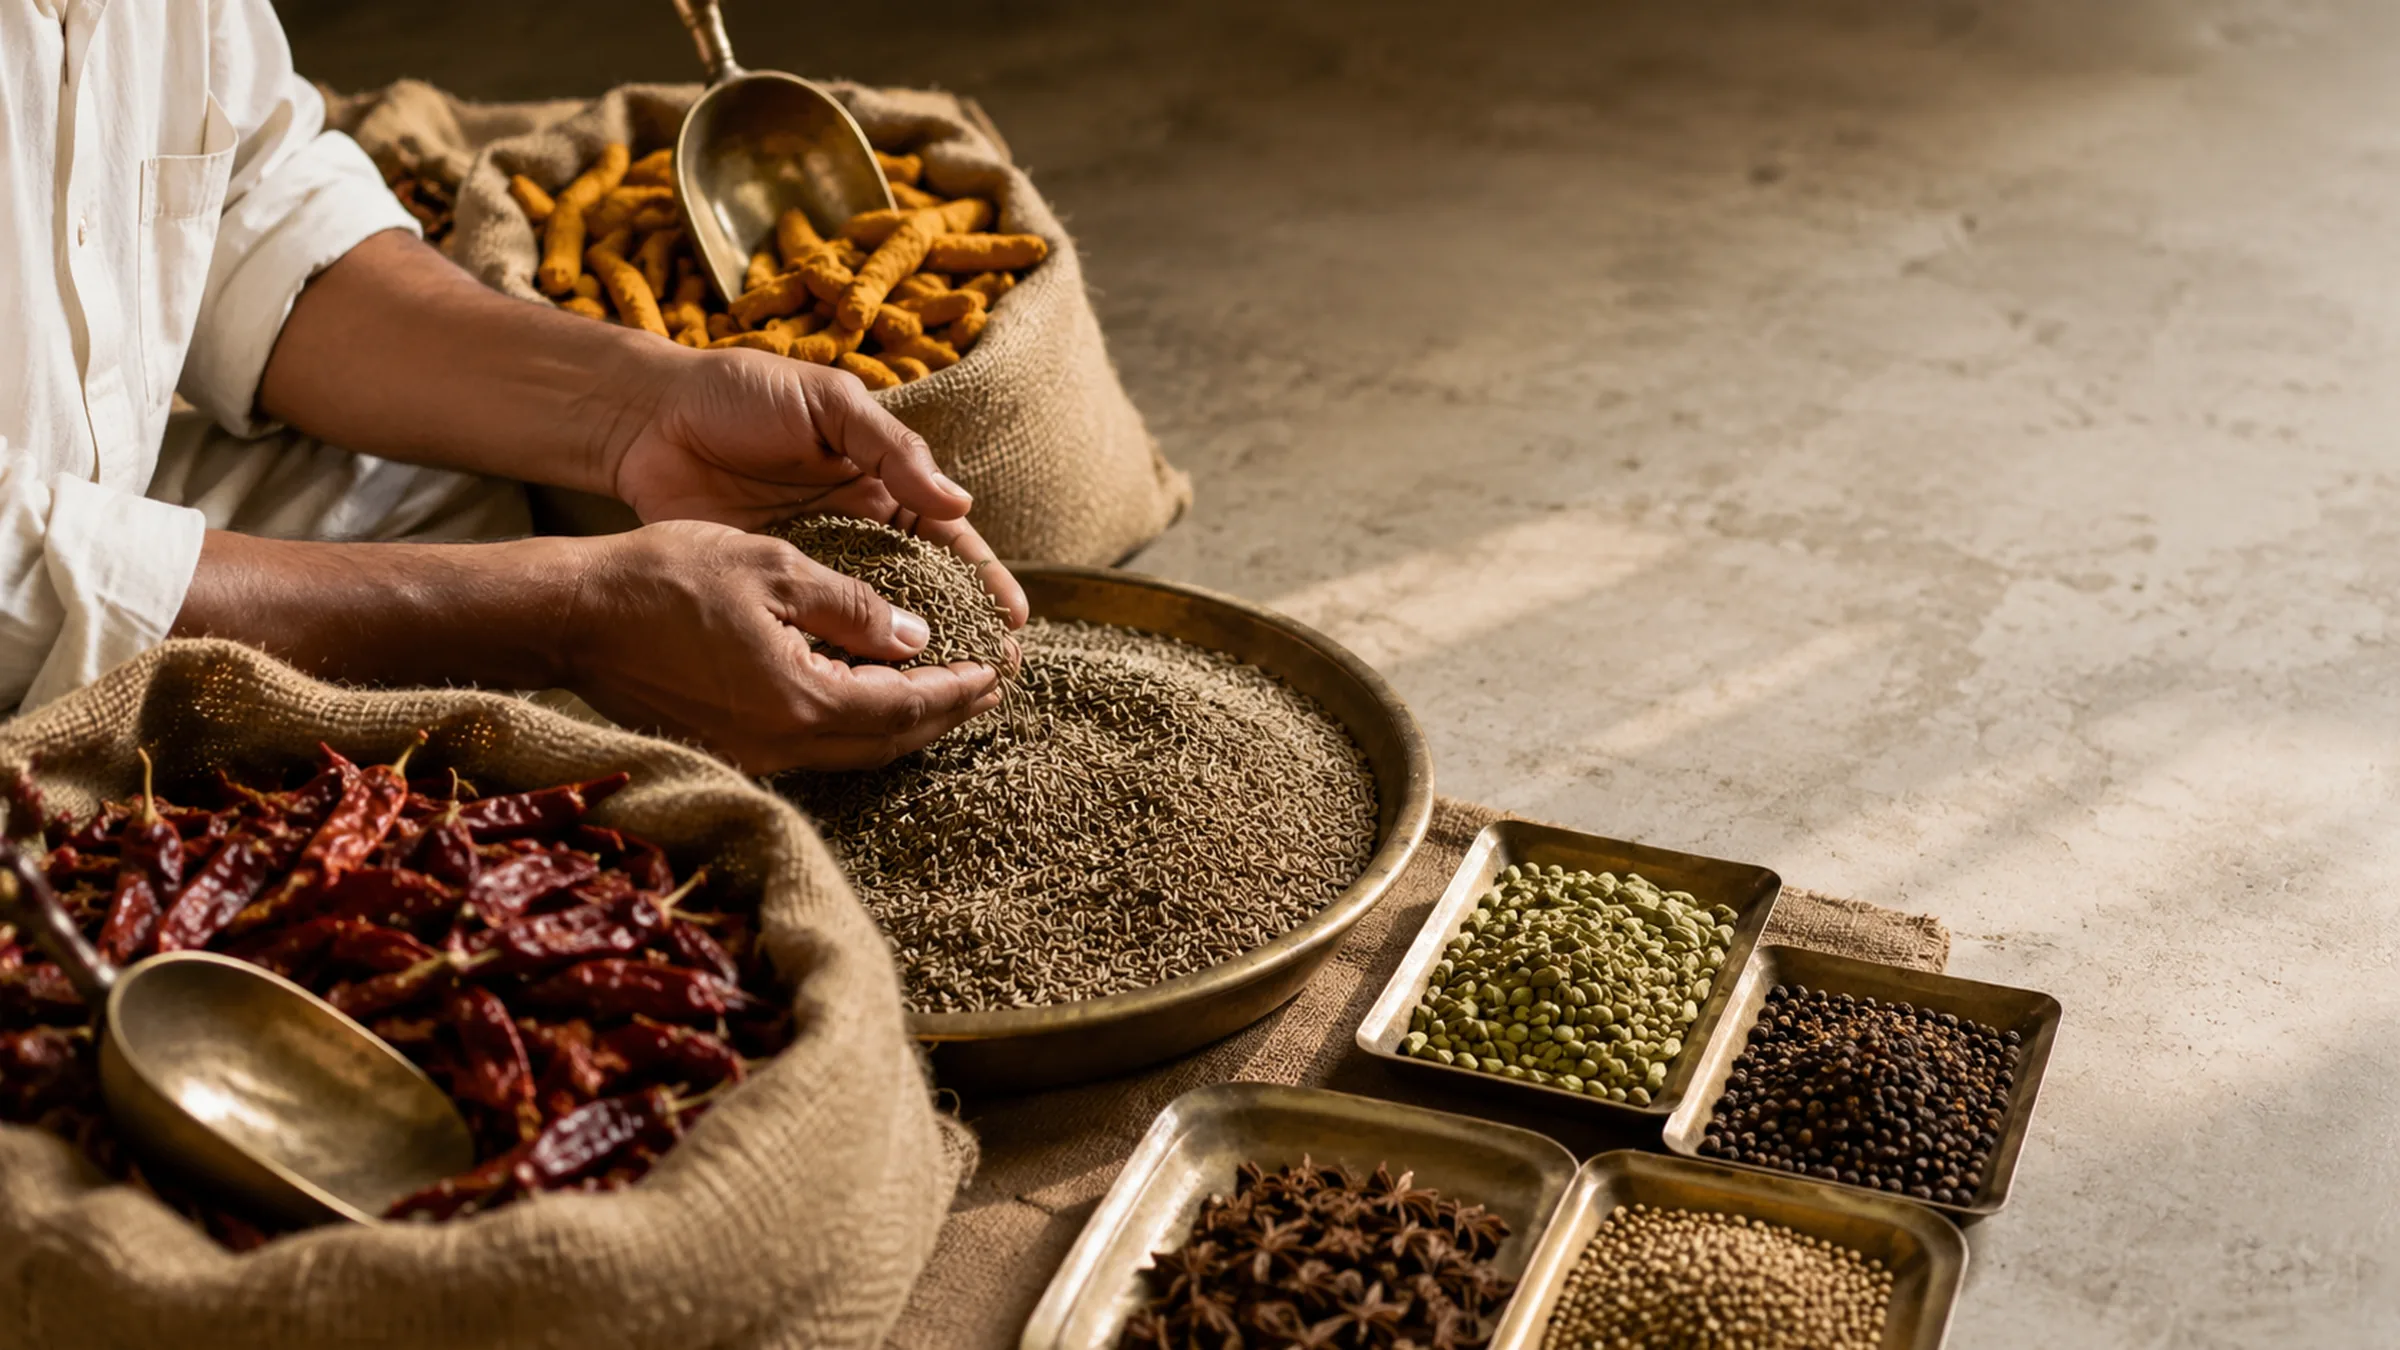
We export every spice India grows.
All 55 spices on the Spices Board schedule — chilli, turmeric, cumin, cardamom, pepper and the long tail — in the grade, form and packing your market needs. Every product we ship comes with its specification, ITC-HS classification and the compliance dossier your border control will ask for.
- Total spice exports
- 17.34lakh t
- FY2025-26, Spices Board
- Export value
- US$4,430.90M
- down ~6% year on year
- Scheduled spices
- 55
- Spices Board Act schedule
- Sourced market pages
- 935
- 16 with market-specific data
What we export
The spices that move in containers
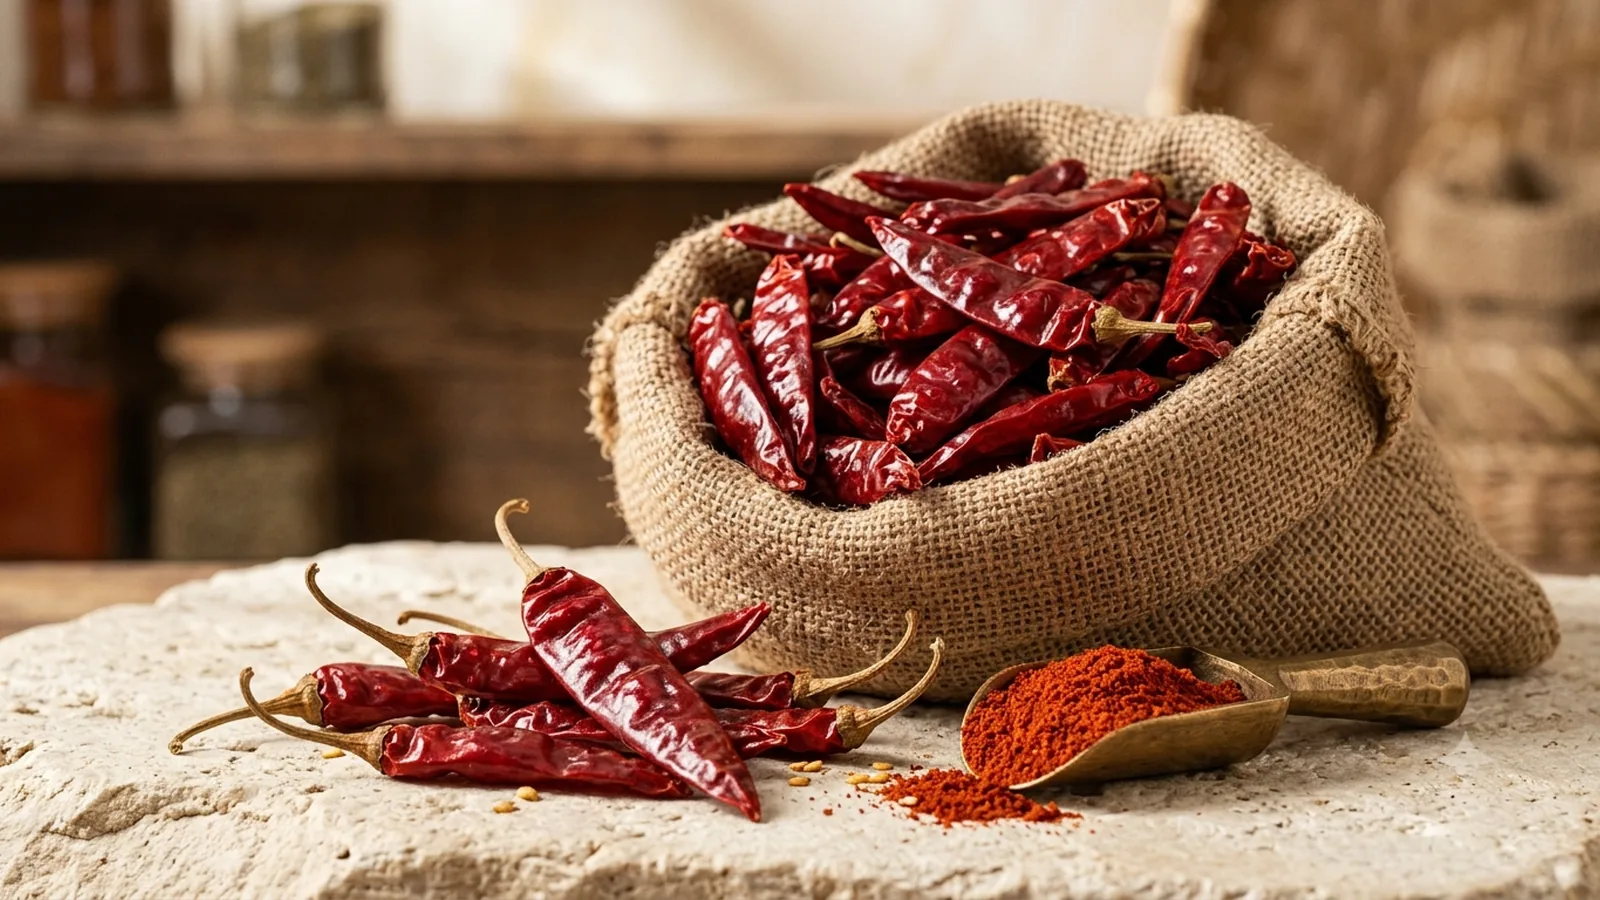
India’s single largest spice export — 27% of the basket by value — and the one product where heat and colour are two separate specifications you cannot buy in one pod.
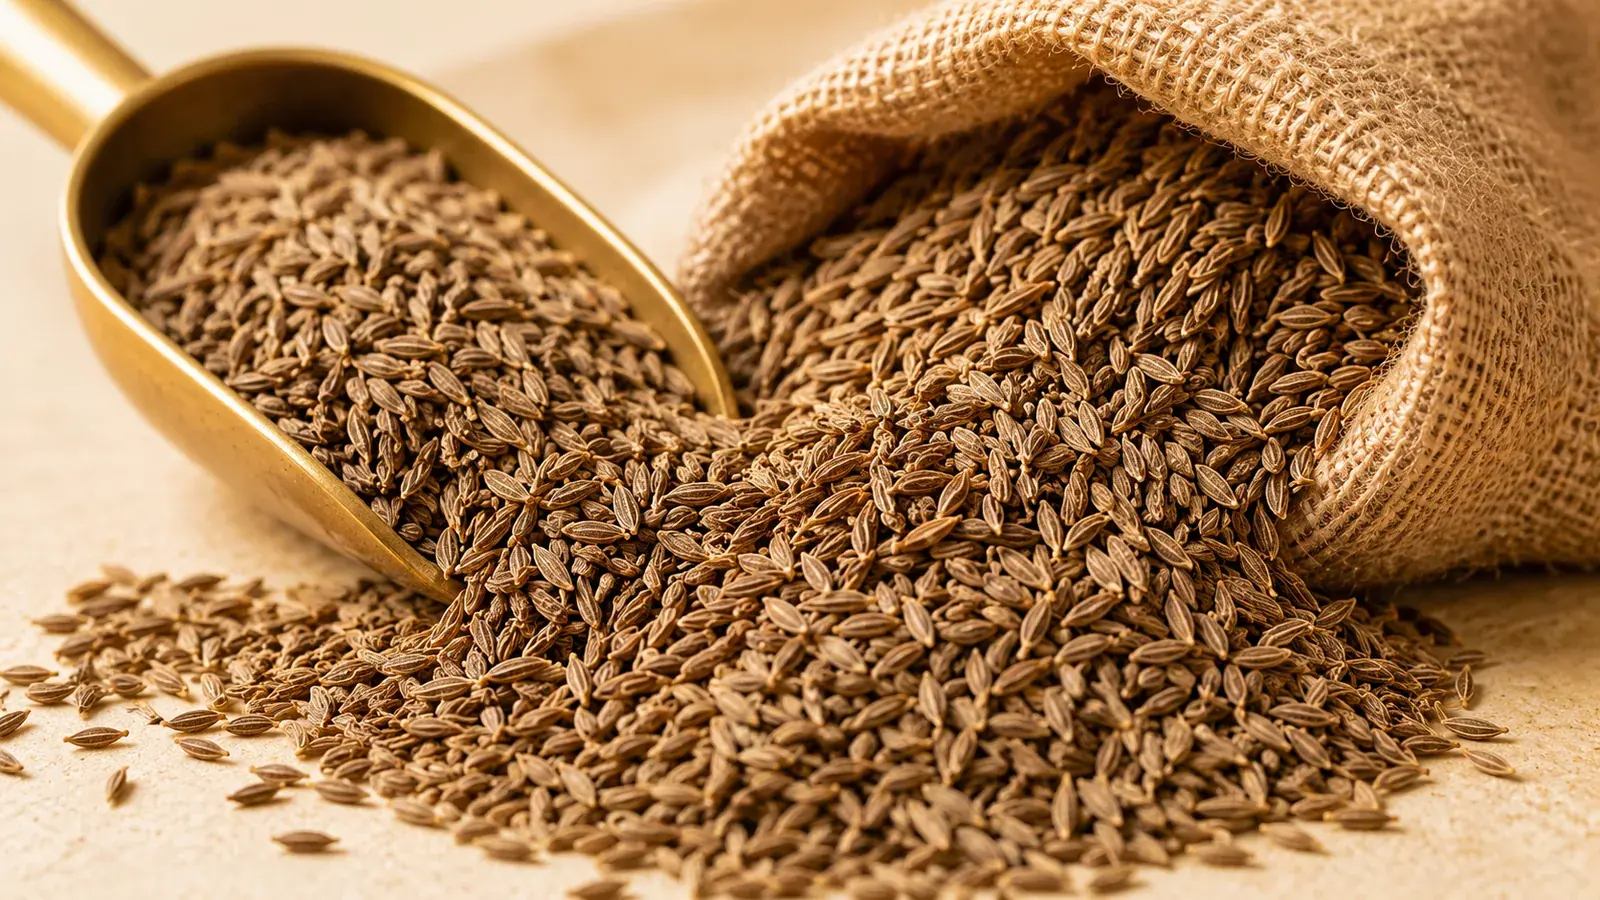
India produces the bulk of the world’s cumin and prices it every morning at Unjha — but the EU now checks Indian cumin at 30% for pesticides.
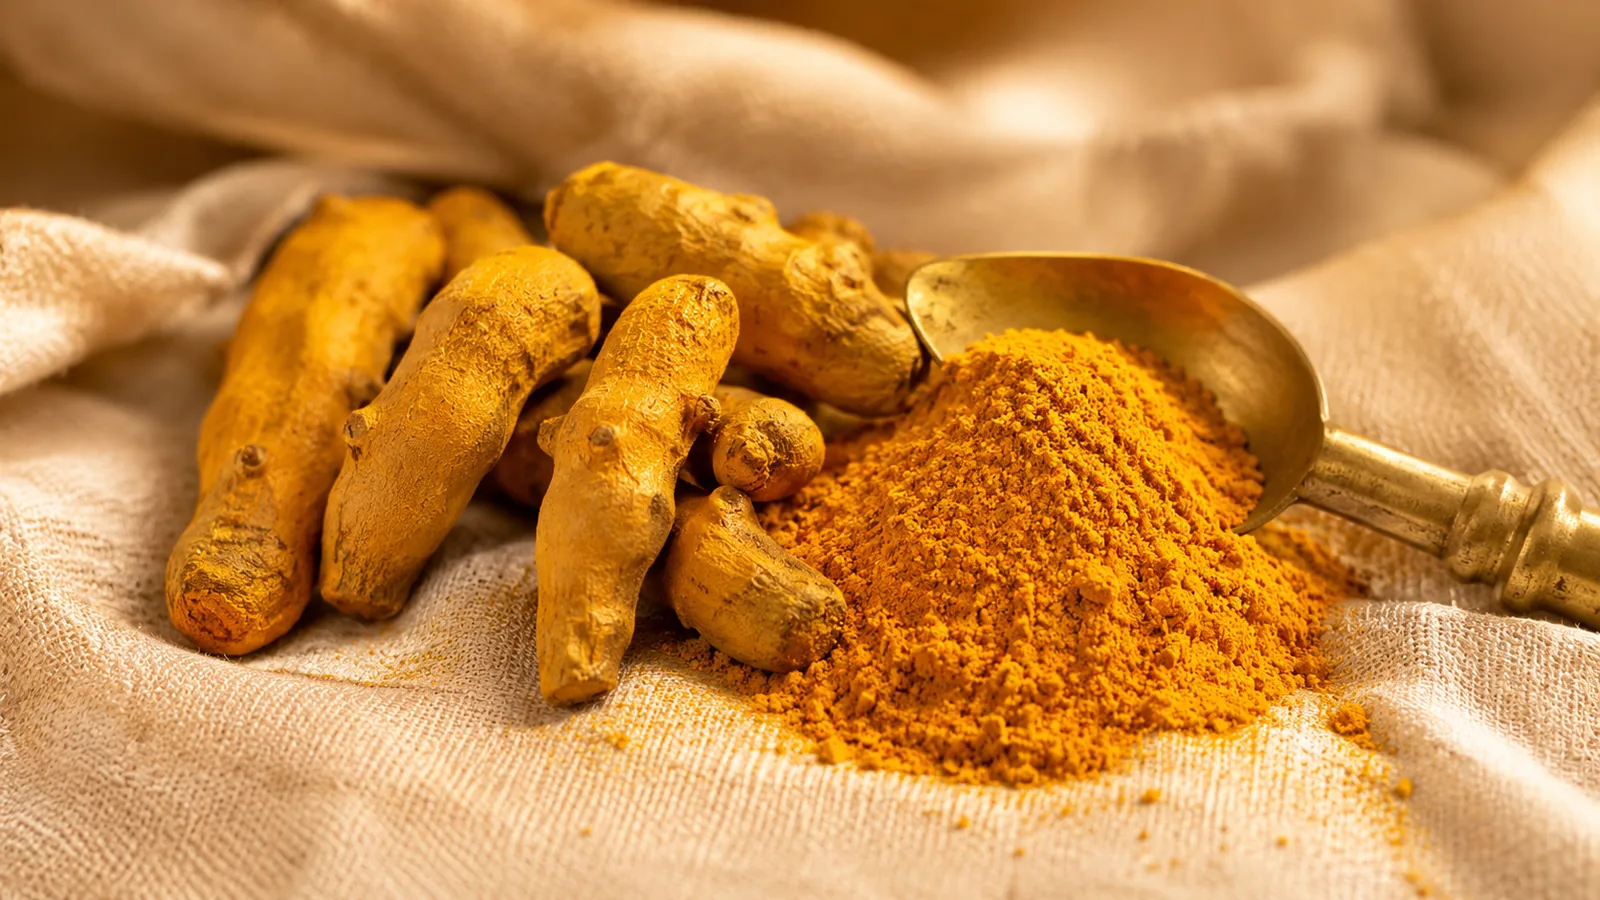
Curcumin is an origin fact, not a grade you can dial up — Alleppey finger’s 4–6% floor sits above Nizamabad’s ceiling.
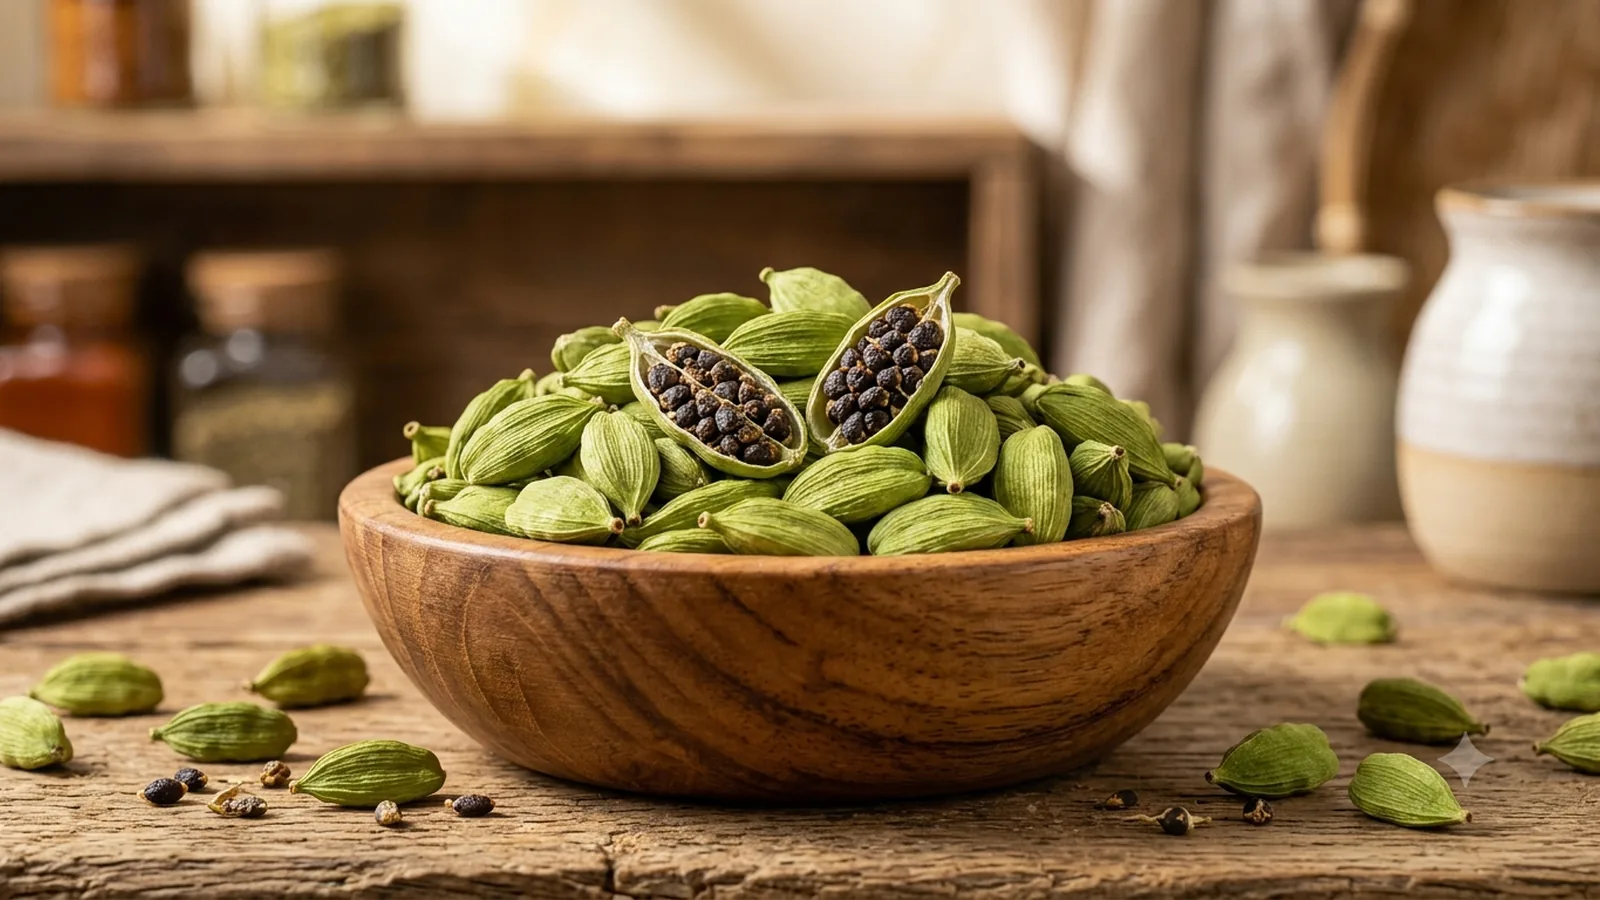
India is the world’s highest-priced cardamom origin, sold at Kerala auction floors that set the domestic benchmark every afternoon.
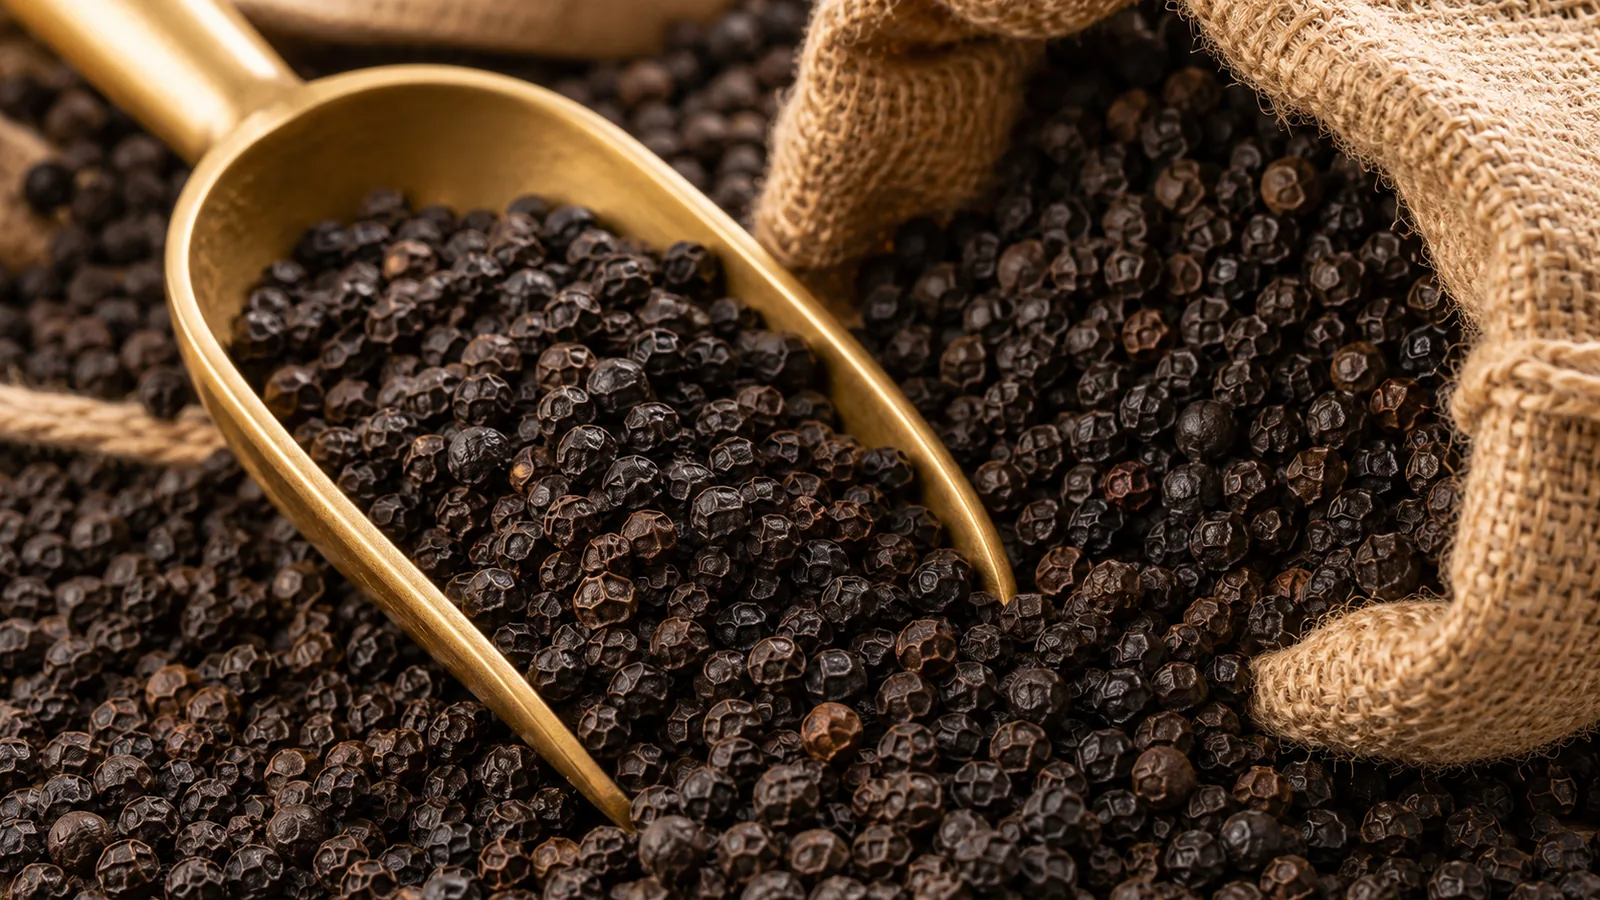
The origin of the trade’s benchmark grades — Malabar Garbled and Tellicherry Extra Bold — and the spice the EU checks hardest for Salmonella.
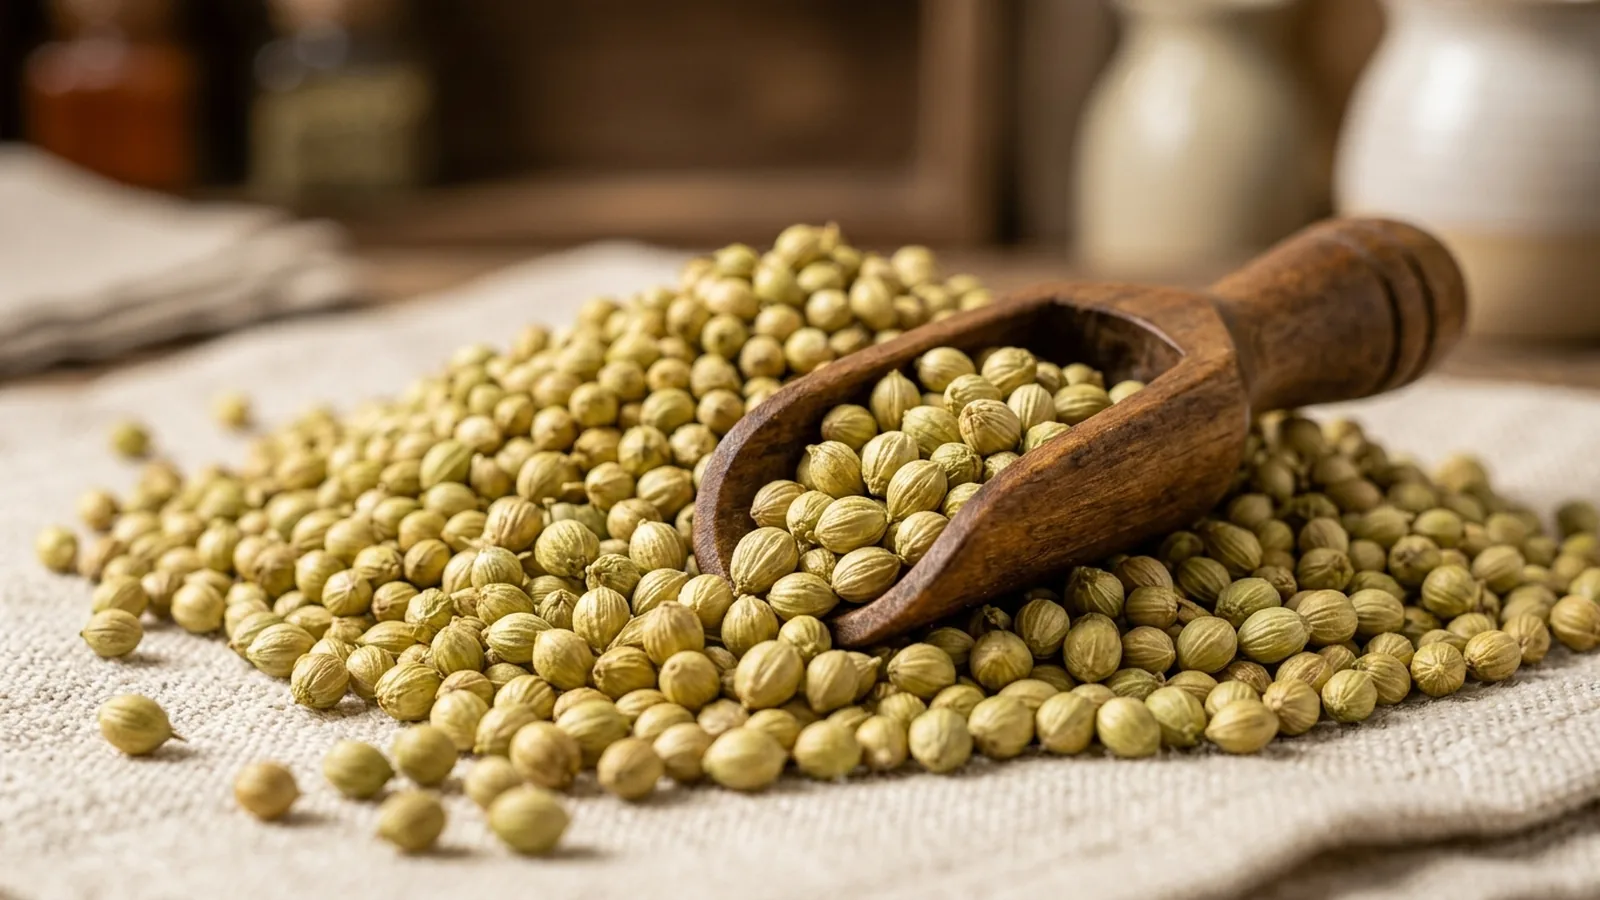
Traded on colour and splitting behaviour — bright green "eagle" seed for whole sale, single/double parrot grades for milling.
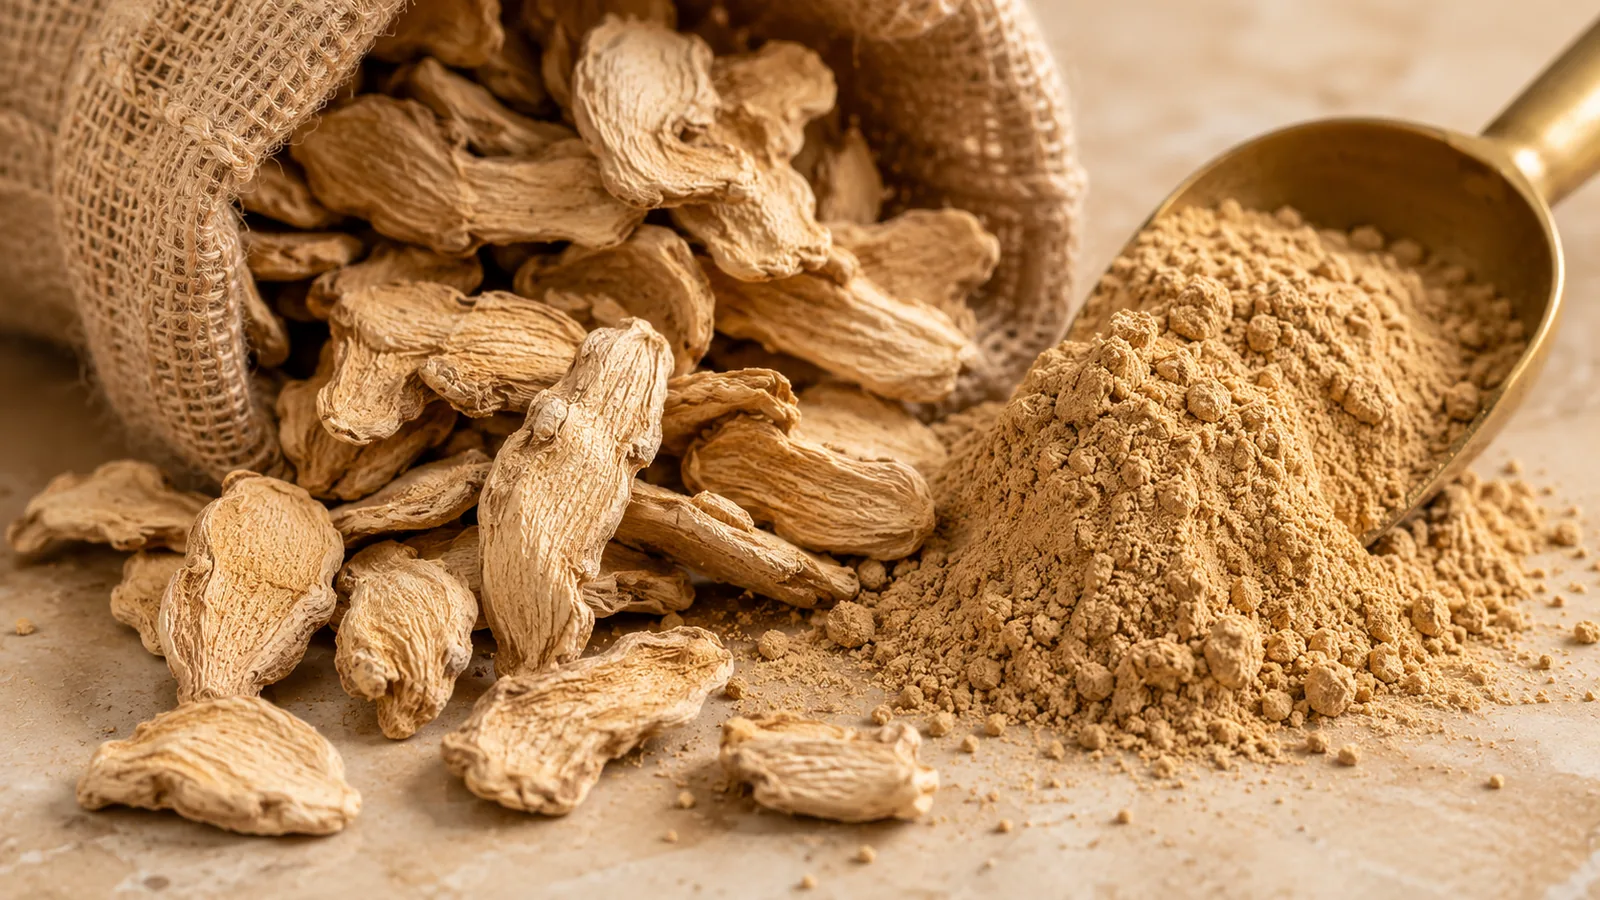
Exported both fresh and as dry ginger (sonth), with the Northeast’s low-fibre GI gingers commanding a premium.
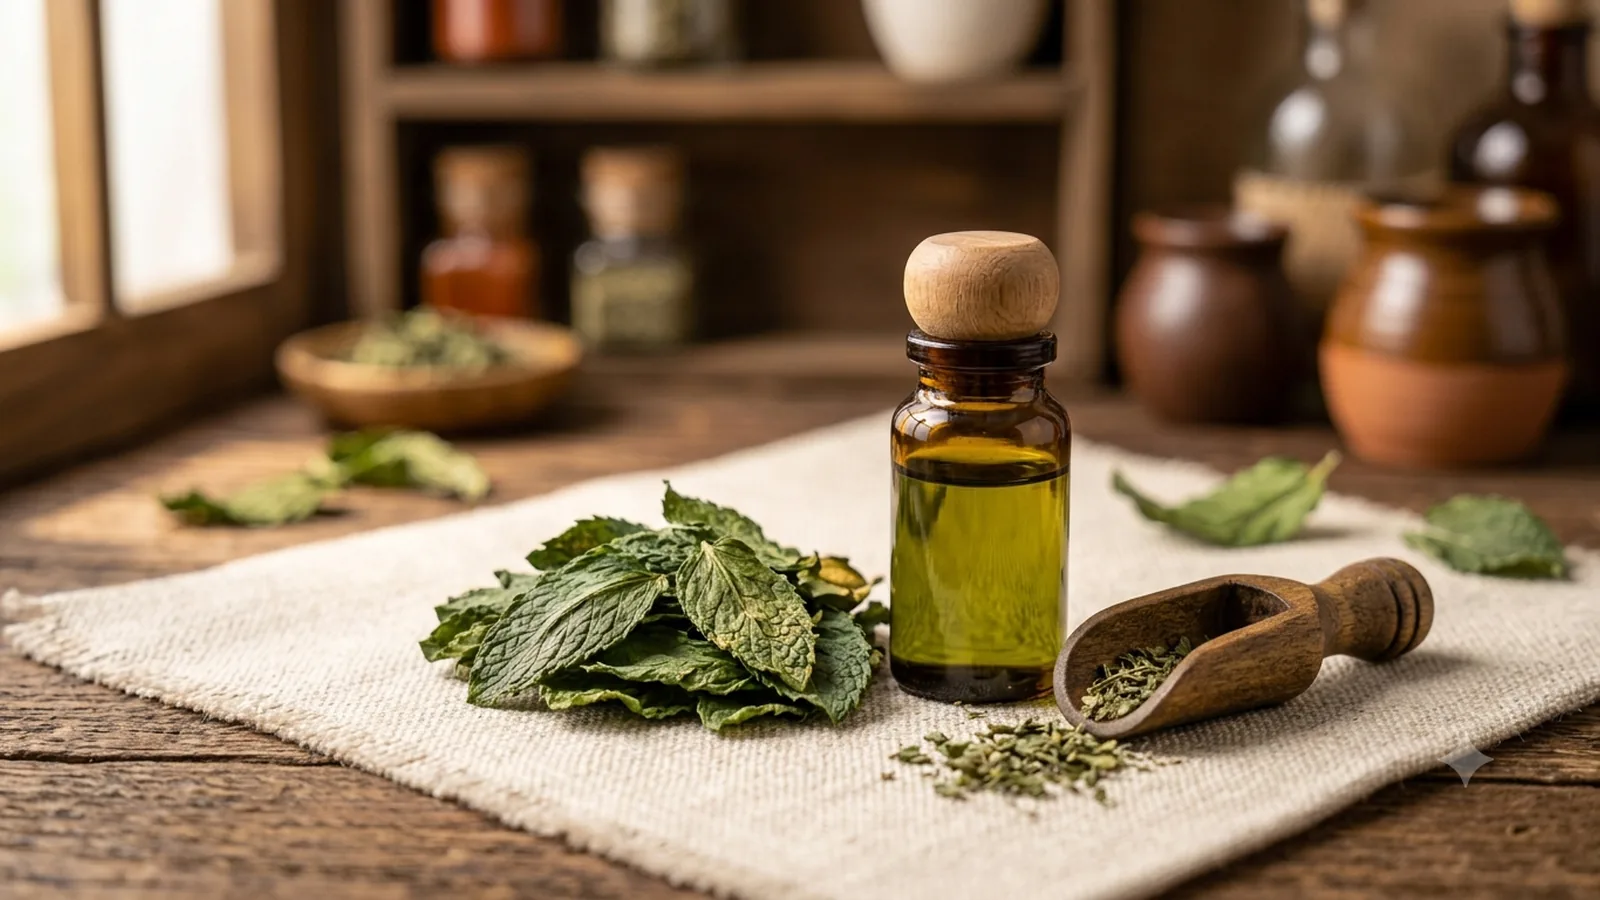
The quiet giant of the basket — mint products (menthol, mint oil) are ~8% of India’s spice export value.
How your order ships
From the mandi to your port, with the paperwork that clears it
You specify
Tell us the spice, the grade (ASTA, SHU, curcumin, purity), the form, your packing and destination. If you are not sure, we spec it with you.
Our catalogue →We source
We buy from the origin that actually delivers that spec — Unjha for cumin, Guntur for chilli, Kochi for pepper — and consolidate to your volume.
The origins →We ship it clean
Grading, steam sterilisation and accredited pre-shipment testing, then the full document set, so the container clears border control first time.
The compliance →Explore the reference
Everything, indexed and sourced
All 55 scheduled spices, botanical name to grade spec.
Open →Spice supplier pages for every market we export to.
Open →EU/US limits, ETO, aflatoxin, 2019/1793 checks, CRES.
Open →All 29 GI spices, with which registrations have lapsed.
Open →ITC-HS classification — where duty is actually decided.
Open →Guntur vs Byadgi, cassia vs Ceylon — with a verdict.
Open →Basket, destinations, EU limits — sourced, with JSON.
Open →How to import, verify a supplier, and pass EU checks.
Open →The shape of the trade
One big commodity, and a long tail
India's spice export basket is one commodity and a long tail
Chilli alone is 27% of export value by the Spices Board's FY2025-26 figures — more than twice the next commodity. The basket is far more concentrated than 'India, land of spices' suggests.
- Chilli27%
- Cumin12%
- Spice oils & oleoresins12%
- Small cardamom9%
- Mint products8%
- Turmeric7%
- Curry powder/paste6%
- Ginger3%
- Pepper3%
- Coriander2%
Show the data as a table
| Commodity | Share |
|---|---|
| Chilli | 27% |
| Cumin | 12% |
| Spice oils & oleoresins | 12% |
| Small cardamom | 9% |
| Mint products | 8% |
| Turmeric | 7% |
| Curry powder/paste | 6% |
| Ginger | 3% |
| Pepper | 3% |
| Coriander | 2% |
Share of export value, Spices Board of India, FY2025-26 (provisional). A linear scale is used deliberately — a log scale would flatter the tail and undo the argument.
Where India's spices go, by share of export value
Fifteen destinations shown in one hue — colour would only re-encode the label. The USA leads on FY2025-26 share, but the prior-year absolute values put China first (see the source-conflict register).
- United States14%
- China12%
- UAE9%
- Bangladesh8%
- Saudi Arabia5%
- United Kingdom3%
- Thailand3%
- Malaysia3%
- Indonesia3%
- Germany2%
- Netherlands2%
- Canada2%
- Australia2%
Show the data as a table
| Destination | Share |
|---|---|
| United States | 14% |
| China | 12% |
| UAE | 9% |
| Bangladesh | 8% |
| Saudi Arabia | 5% |
| United Kingdom | 3% |
| Thailand | 3% |
| Malaysia | 3% |
| Indonesia | 3% |
| Germany | 2% |
| Netherlands | 2% |
| Canada | 2% |
| Australia | 2% |
Share of export value, Spices Board of India, FY2025-26 (provisional). Destination is not a categorical colour axis here — one series, magnitude carried by bar length.
What actually stops a shipment
The four numbers EU buyers live by
of Indian black pepper is physically checked at the EU border for Salmonella.
Read →30%of Indian cumin is checked for pesticide residues (raised January 2025).
Read →0.1mg/kgethylene-oxide limit — a banned pesticide behind the recent EU recalls.
Read →5µg/kgaflatoxin B1 ceiling on dried chilli, paprika, pepper and turmeric.
Read →Geographical Indications
10 of India’s 29 GI spices had lapsed registrations
A GI ties a spice to its place — but a lapsed GI mark may no longer be protected. We show validity, not just the badge, so the claim on your carton holds up.
See the GI register →Our trust signature
When the sources disagree, we show both
Most spice-trade pages assert one confident number, which is why the same question has two wrong answers across the web. We publish the disagreement, dated and sourced.
Is the USA or China India’s largest spice export market?
On the latest year (FY2025-26, Spices Board share) the USA is India’s largest spice market at 14%, with China at 12%. On the prior year’s absolute values (IBEF) China led. State the year and the metric — never just "the largest market is X".
| Source | Says | Metric | Period | Published |
|---|---|---|---|---|
| IBEFT2 | China: 768.5 US$ million | Absolute export value | FY2024-25 | |
| IBEFT2 | United States: 654.71 US$ million | Absolute export value | FY2024-25 | |
| Spices Board of IndiaT1 | United States: 14 % of export value | Share of total export value | FY2025-26 | |
| Spices Board of IndiaT1 | China: 12 % of export value | Share of total export value | FY2025-26 |
Why they differ
These are different years AND different metrics — not a factual dispute. IBEF ranks by absolute value for FY2024-25 and puts China first; the Spices Board ranks by share of export value for FY2025-26 and puts the USA first. China buys bulk, lower-unit-value chilli and cumin, so it can lead on tonnage-driven value in one year and trail on value share in the next as prices move. Both are correct for what they measure.
The trap this prevents: Writing "India’s largest spice market is China" (or "the USA") with no year and no metric.
Start sourcing
Tell us the spice, grade and destination.
We consolidate from vetted processors, oversee QC and pre-shipment testing, and return a documented offer. No owned factory, no invented credentials — just a sourced dossier you can check.
[email protected] · +91 96731 98867 · Pune, Maharashtra, India